Dating Diary
A personal analytic documentary data visualization feature for dating website which helps to improve users' understanding of themselves about their dating preference.

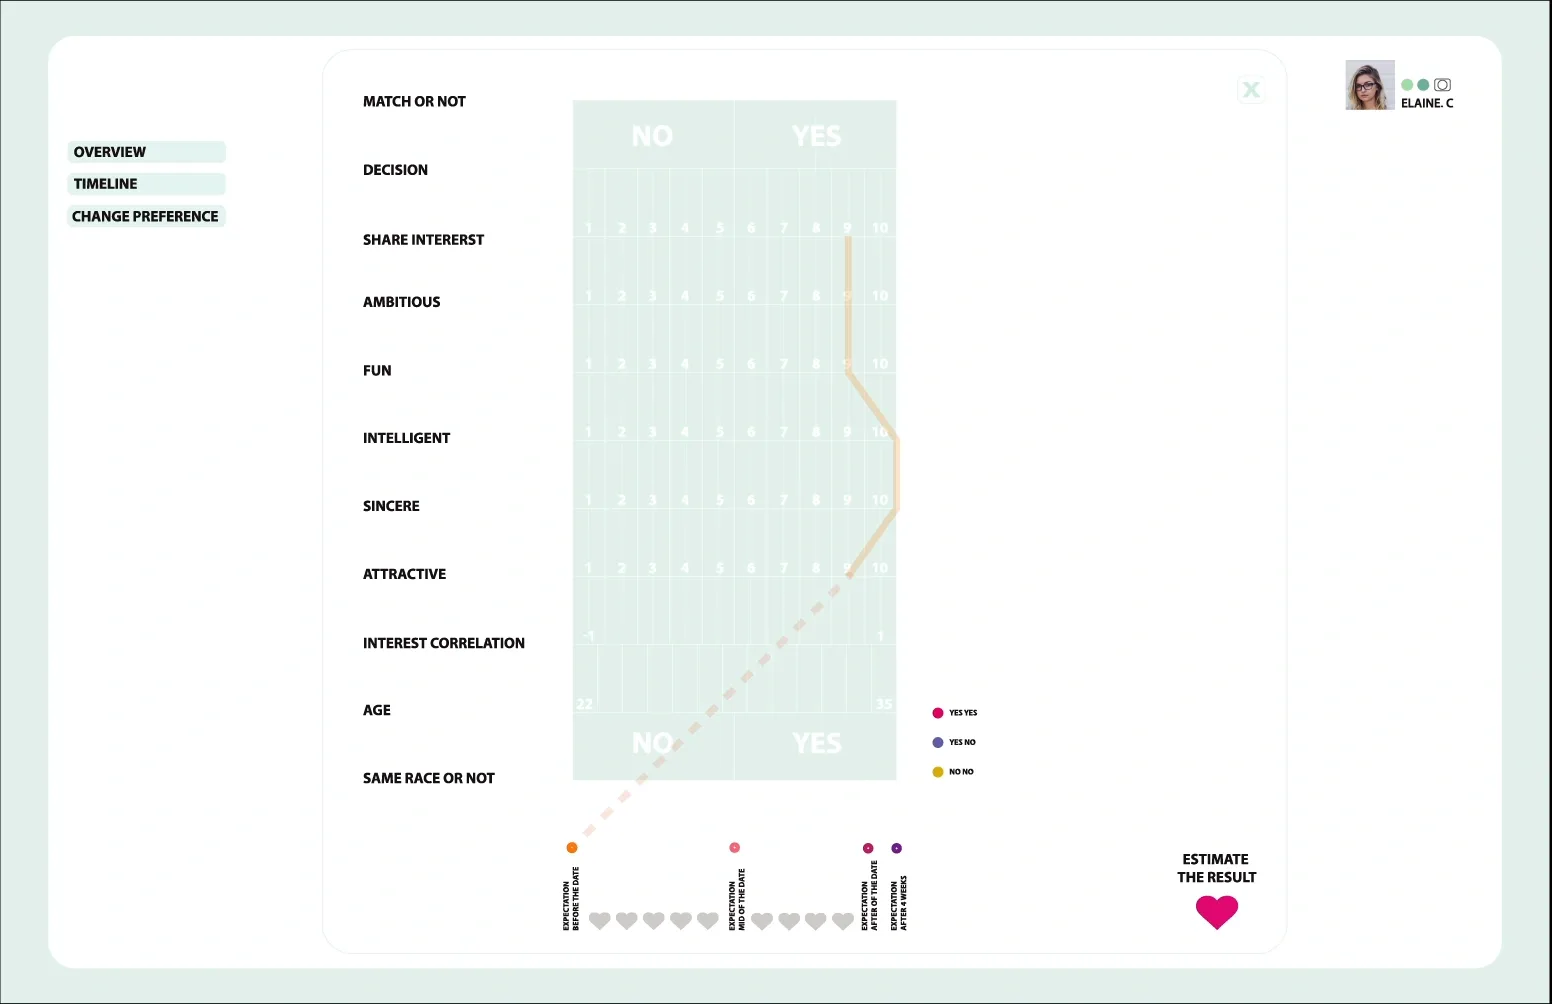
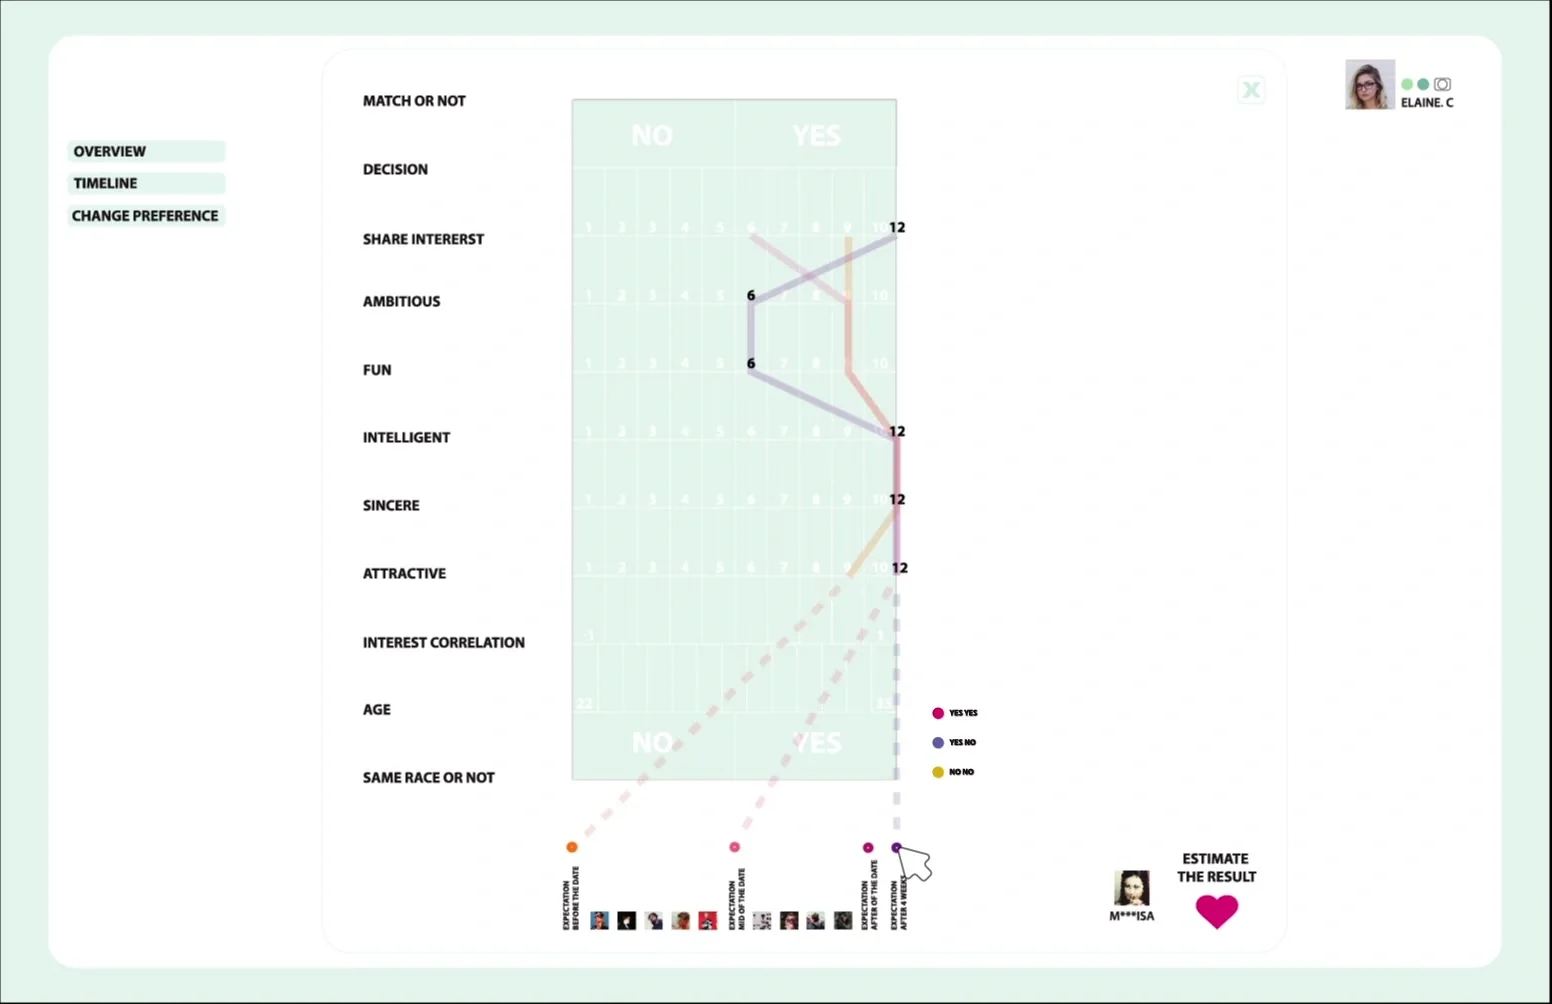
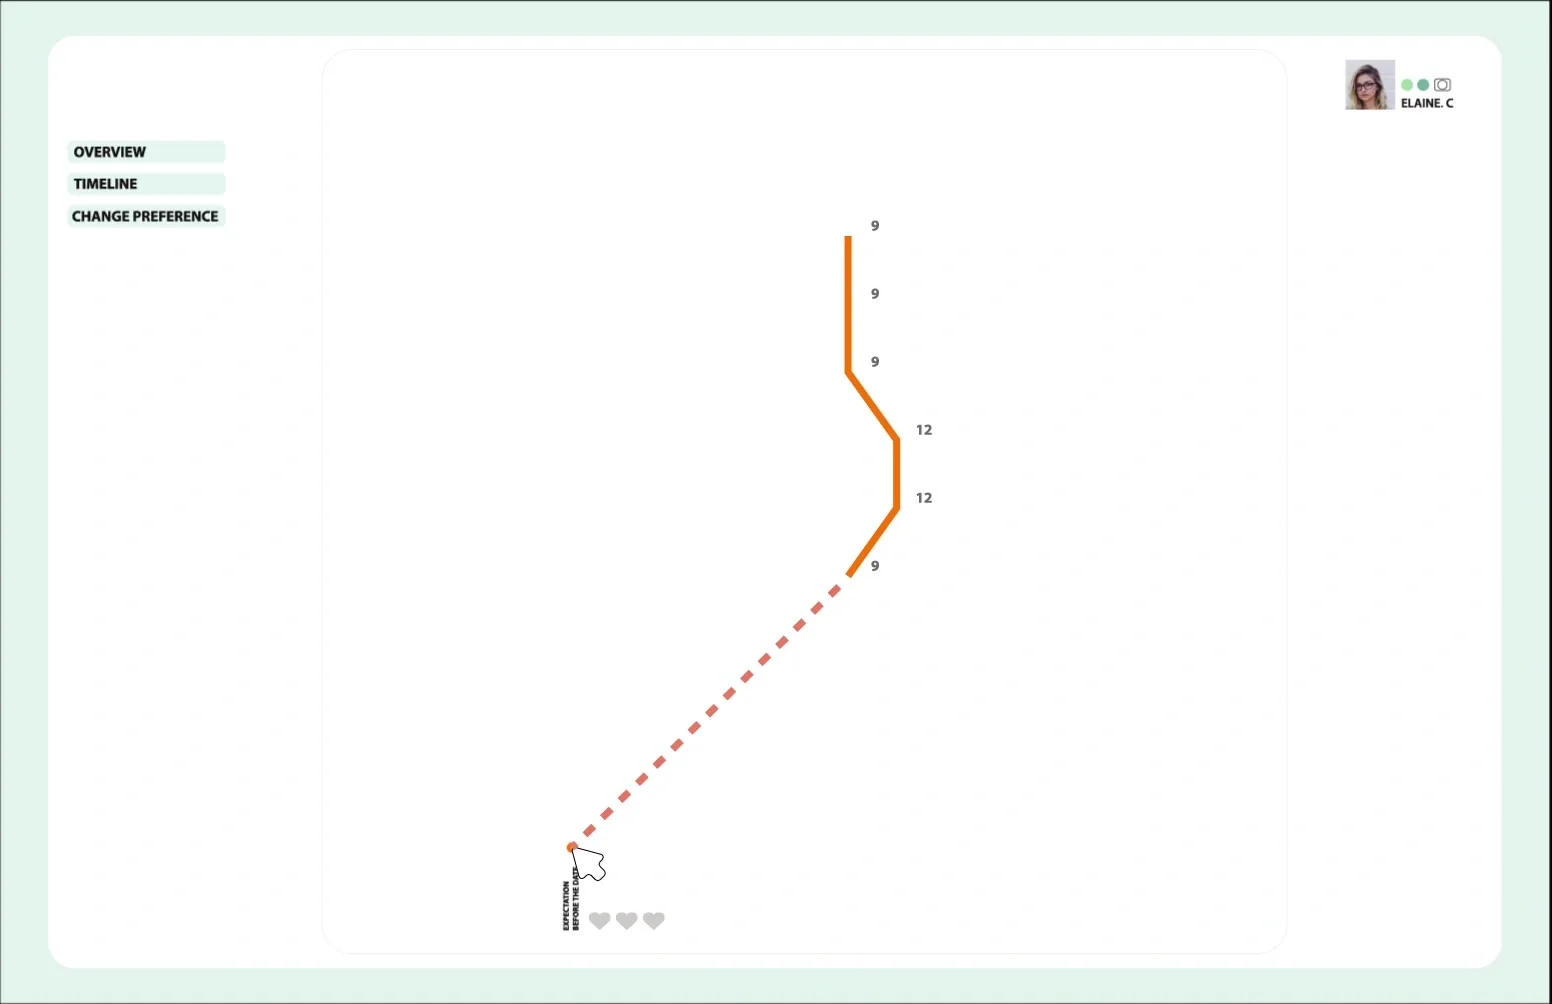
Date Journey — Interactive Data Visualization
Problem of speed dating
- People don’t really know what they really want.
- People don’t know if speed dating works for them or not.
- It’s difficult to track what happens during the date.
- It’s difficult to share dating experience with others because everyone is different.
Persona

- Name : Elaine
- Age : 27
- Position : Grad Student in Arts Administration
- Interest : Art, Exhibition, Music, Concert, Reading, Hiking
She is a single grad school student who has little leisure time but interested in meeting people and making new friends. She enjoys having meaningful and intellectual conversation with people who have similar educational level as she does. She is curious about how will speed dating turn out for her and opened to try speed dating as a way to look for people she might wanna date with.
Goal
- Helping users to use data to understand themselves about dating preferences, such as who they are attractive to, who they want to be with, who are the best match for themselves and also learn the differences between these people.
- Helping users to track of their own dating experience and learn things from failure.
- Giving users a perspective of their dating experience which may happen in the future. To give users the opportunity to take a look at the data of dating experience from people who share common with the them, so that the users can compare their own experience with these people.

Data resource
We found a set of data about speed dating. The data set was compiled by Columbia Business School professors for their paper Gender Differences in Mate Selection: Evidence From a Speed Dating Experiment. Data was gathered from participants in experimental speed dating events from 2002-2004. During the events, the attendees would have a four minute “first date” with every other participant of the opposite sex.
At the end of their four minutes, participants were asked if they would like to see their date again. They were also asked to rate their date on six attributes: Attractiveness, Sincerity, Intelligence, Fun, Ambition, and Shared Interests. The dataset also includes questionnaire data gathered from participants at different time frame in the dating period.
These fields include: demographics, dating habits, self-perception across key attributes, beliefs on what others find valuable in a mate, and lifestyle information.
Chosen data
Before the Speed Date:
- What you look for in the opposite sex. Score with 6 attributions: Attractive, Sincere, Intelligent, Fun
Middle of the Speed Date:
- Same Race?
- Age Gap?
- Interest Correlation?
- What you look for in the opposite sex. Score with 6 attributions: Attractive, Sincere, Intelligent, Fun
After the Speed Date:
- After the date, evaluate individuals you dated with (1-10 based)
- What you look for in the opposite sex. Score with 6 attributions: Attractive, Sincere, Intelligent, Fun
Four weeks after the Speed Date + private dates:
- Your decision ?
- Matches?
- What you look for in the opposite sex. Score with 6 attributions: Attractive, Sincere, Intelligent, Fun
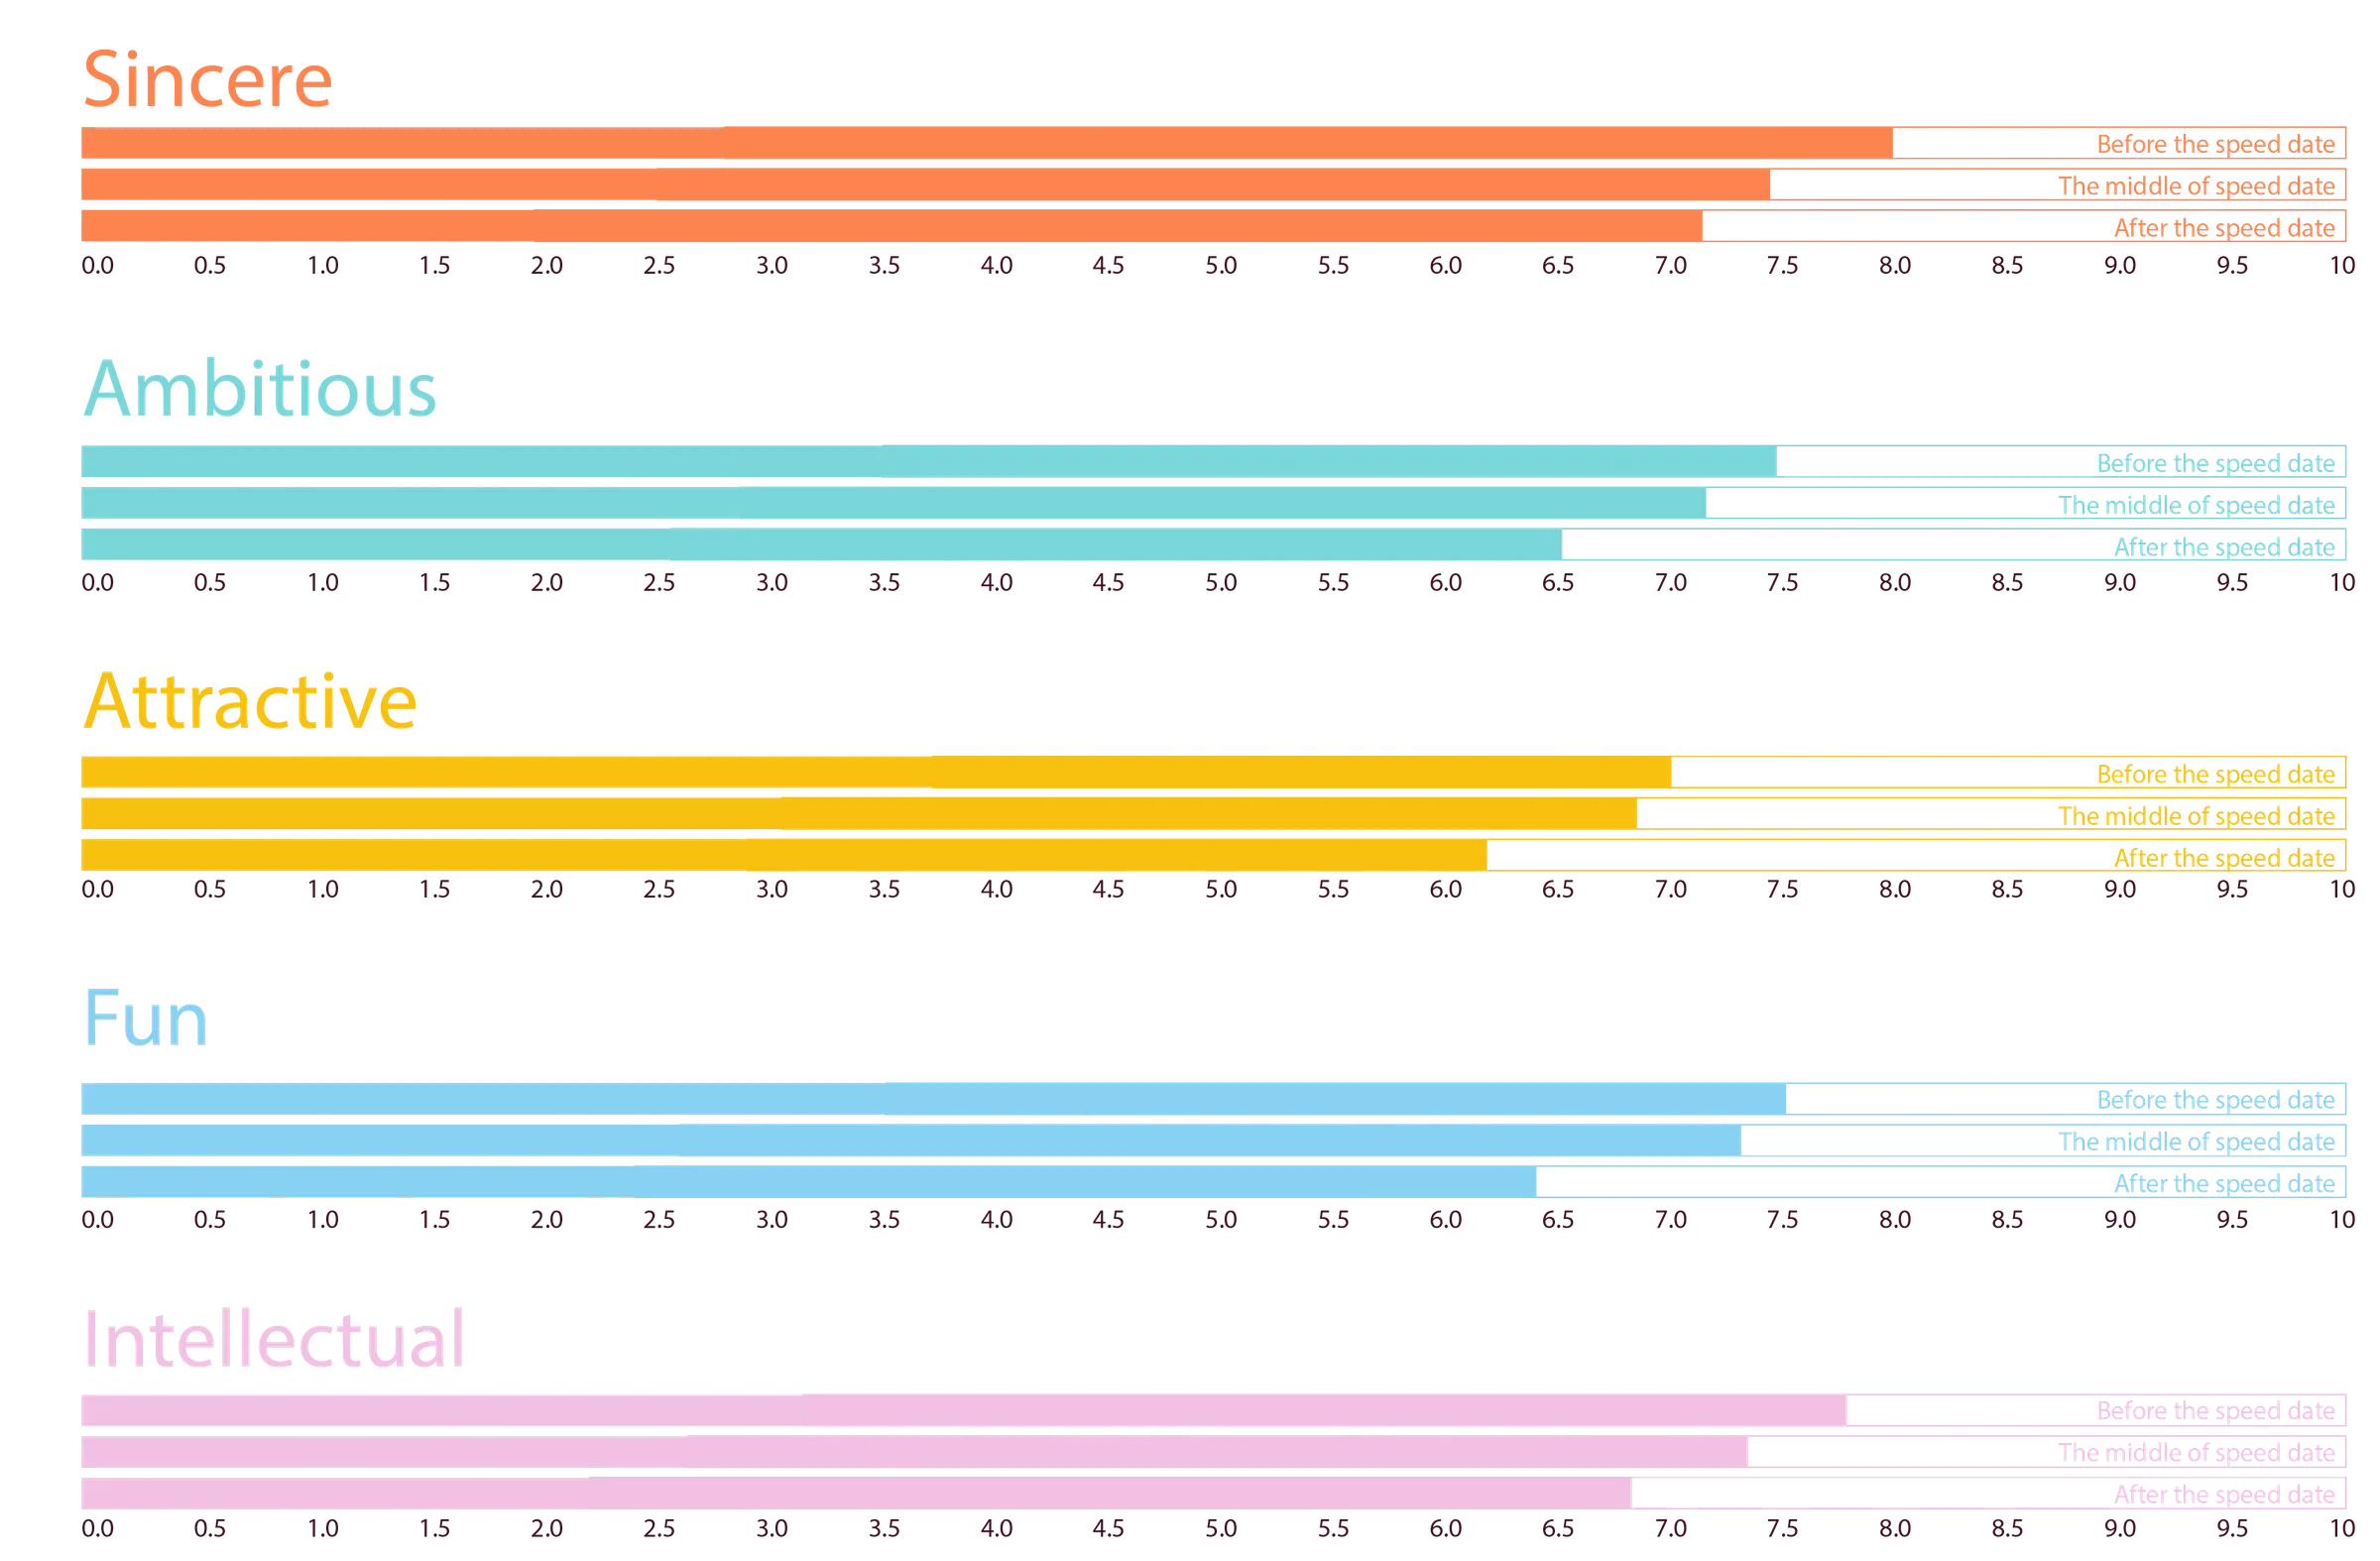
Score Chart
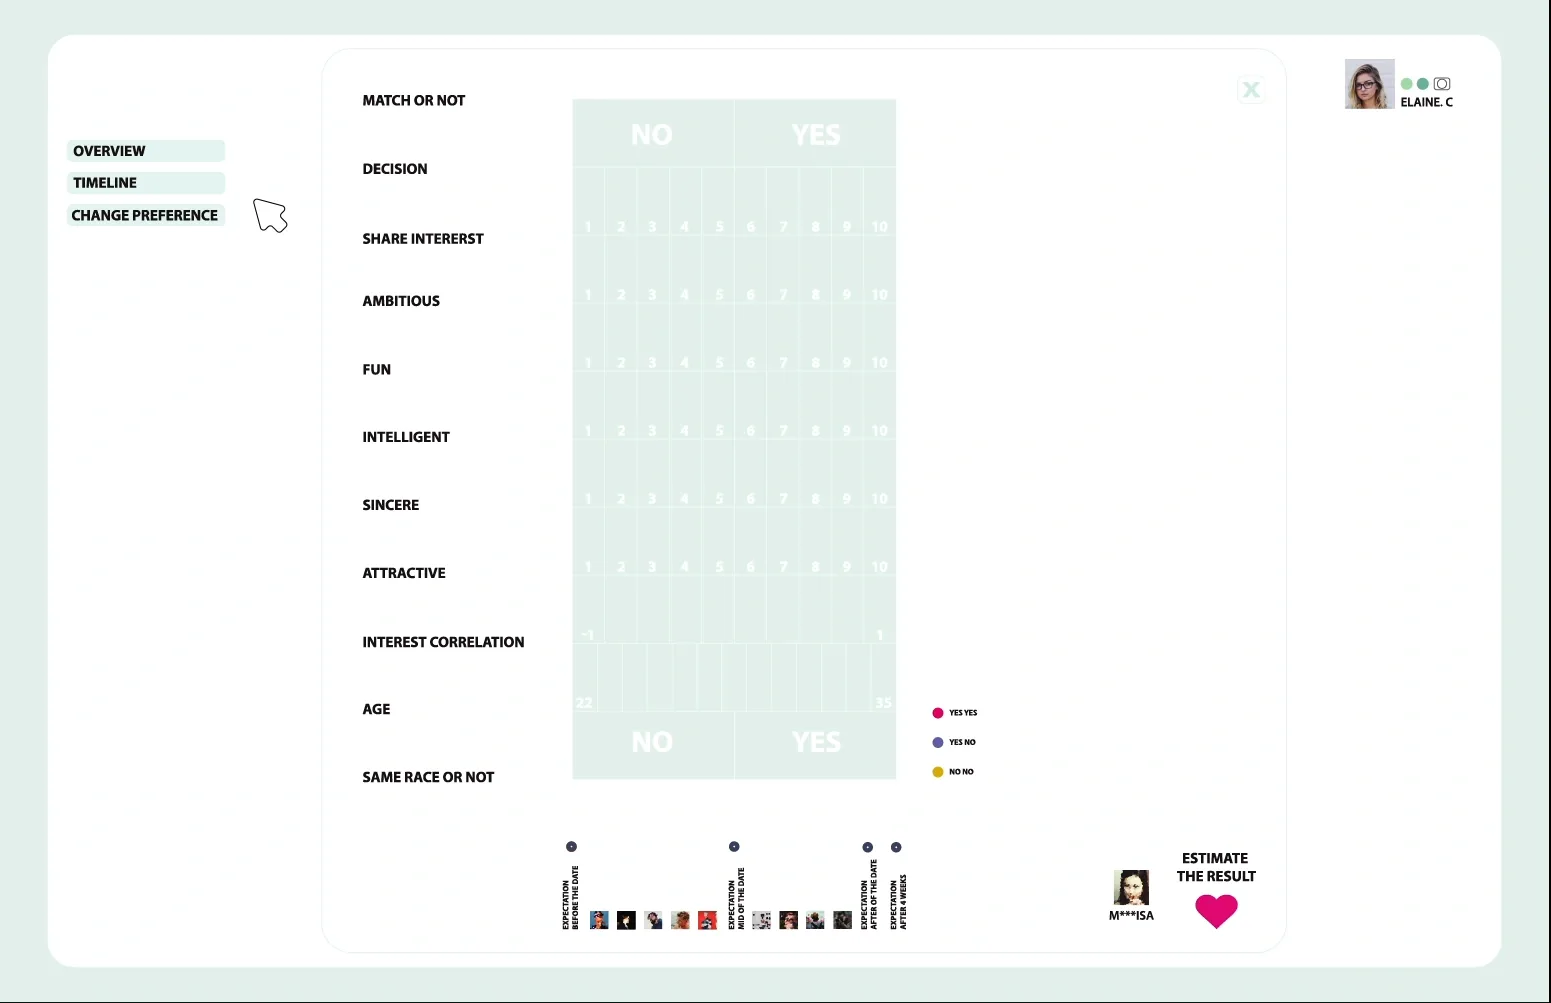
This chart helps you to read all the data you will be collecting during your future date.
Story
After have a glance of the dating data, we’ve found that the expectations change overtime during the dating events which lasted for few weeks. We started to get interested in visualizing the storyline of the dating experience so that we may learn what happens during the date and what changes people’s expectations and what’s the relation between the expectation and the final matches.
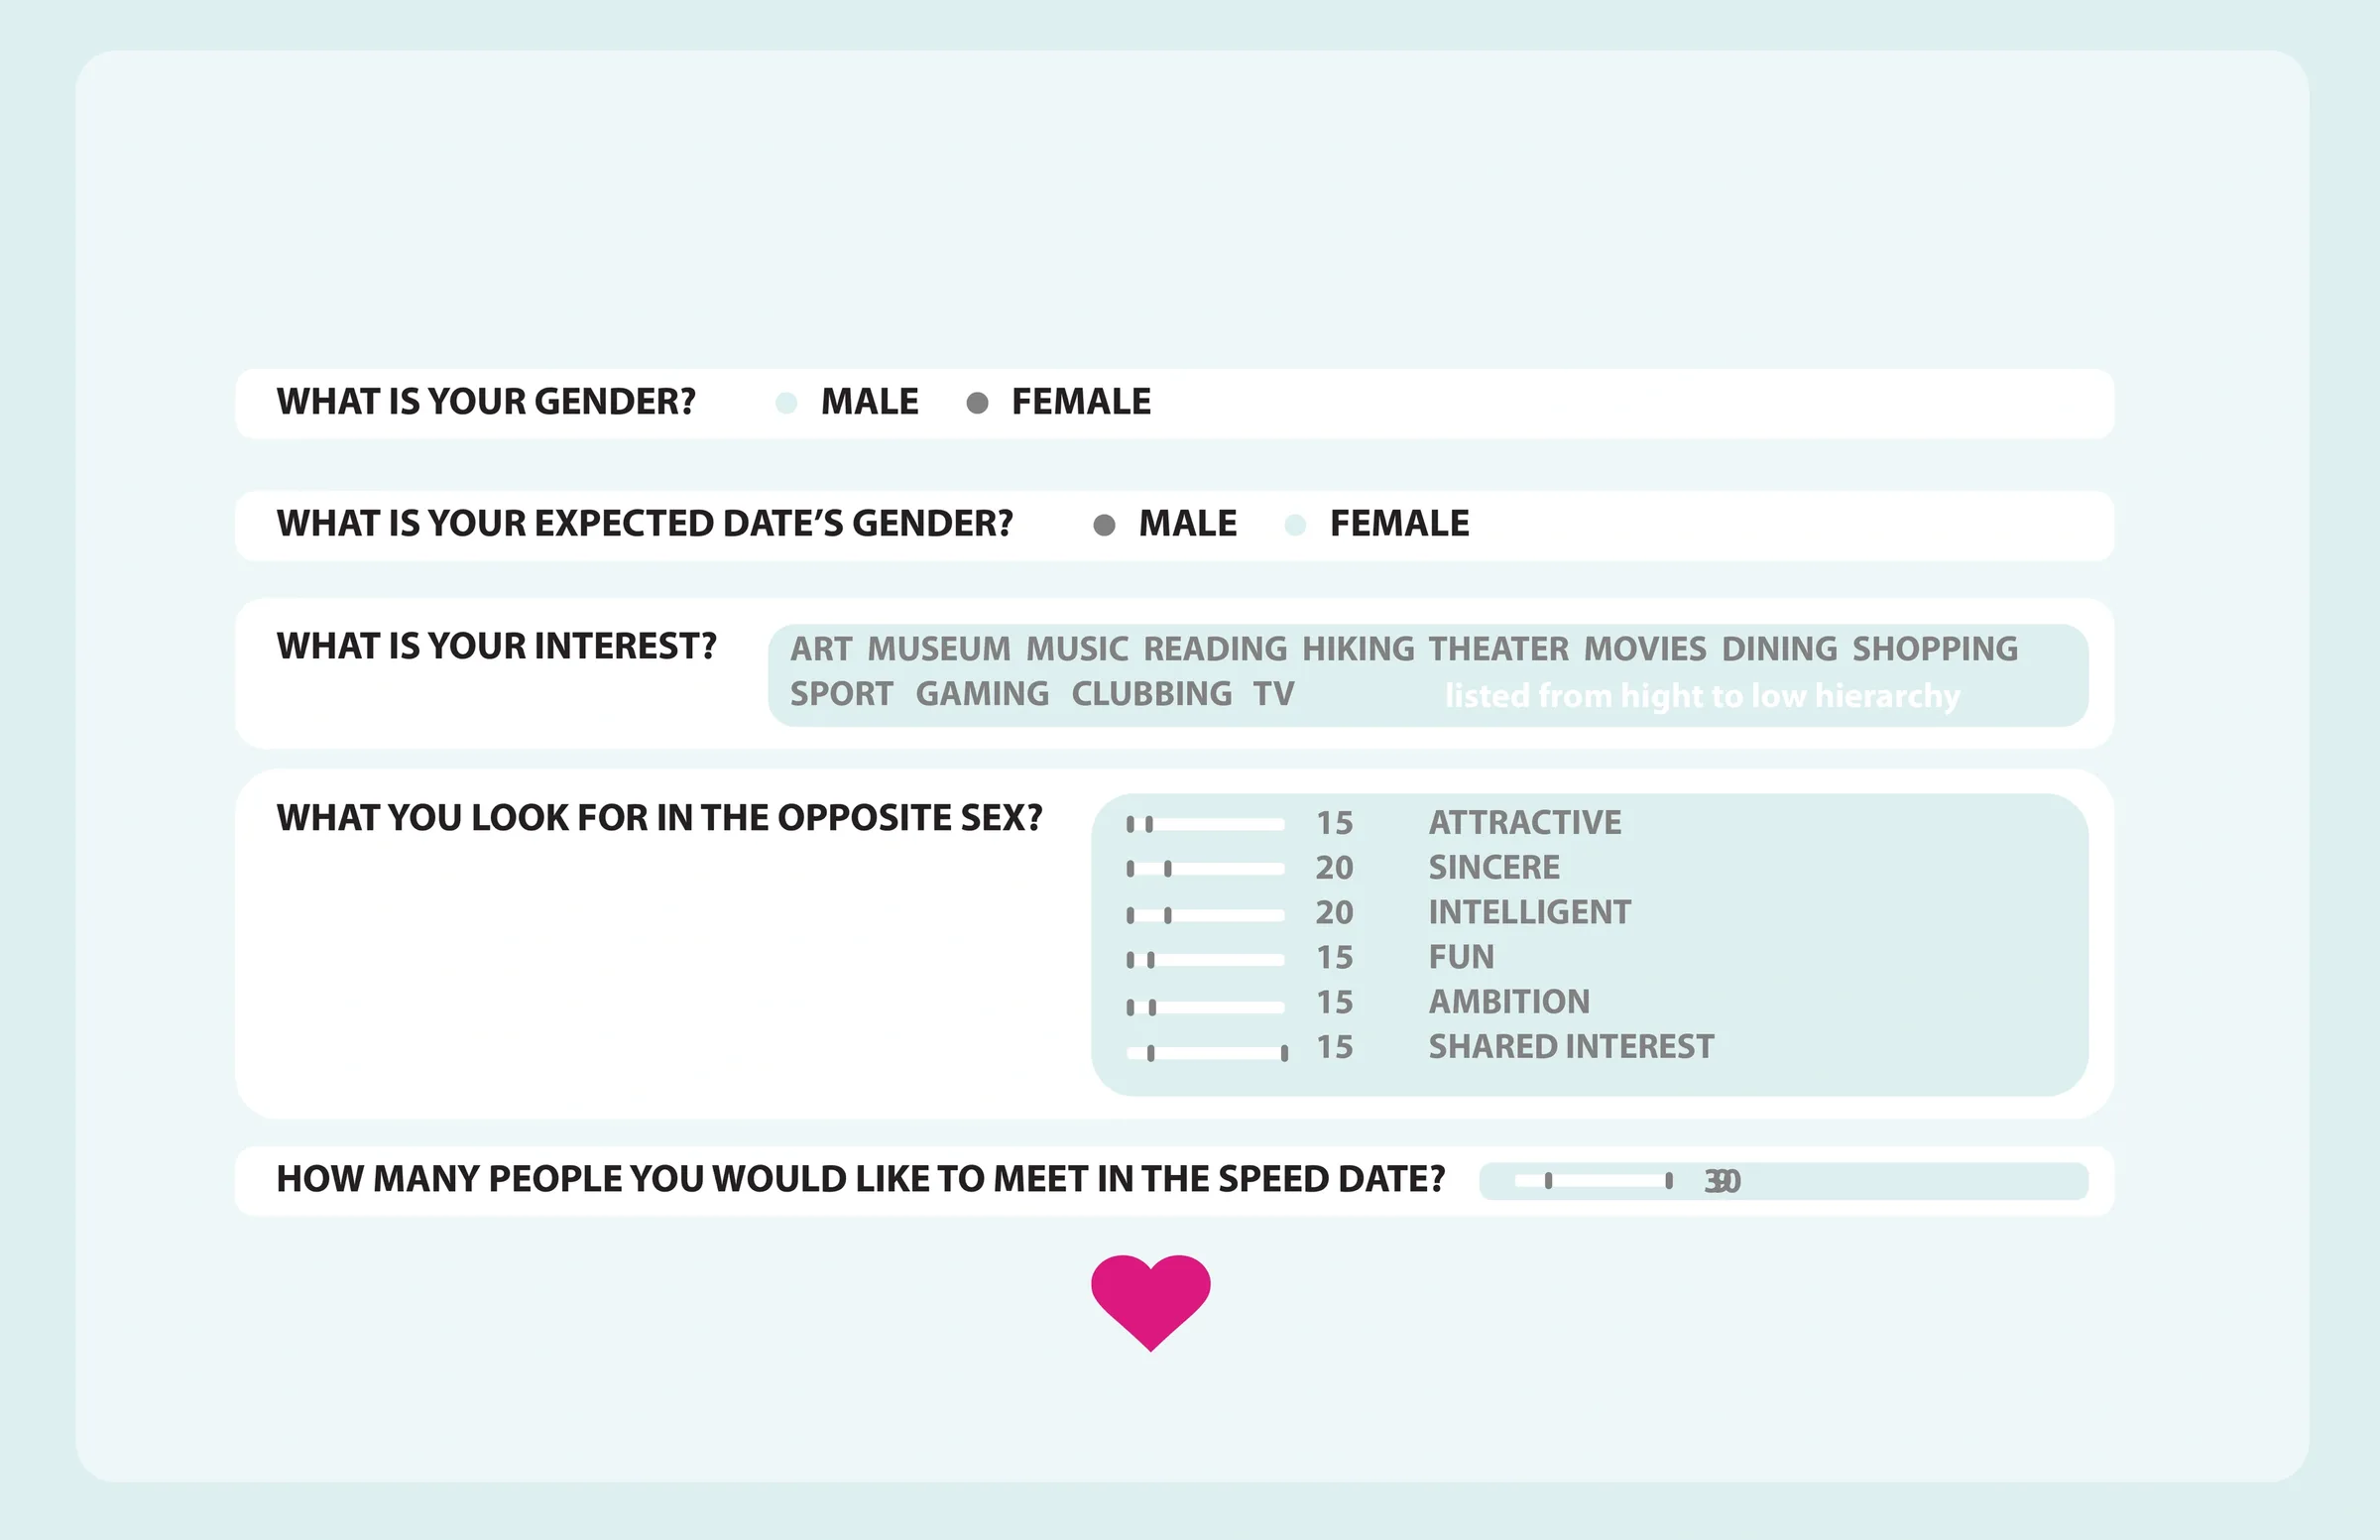
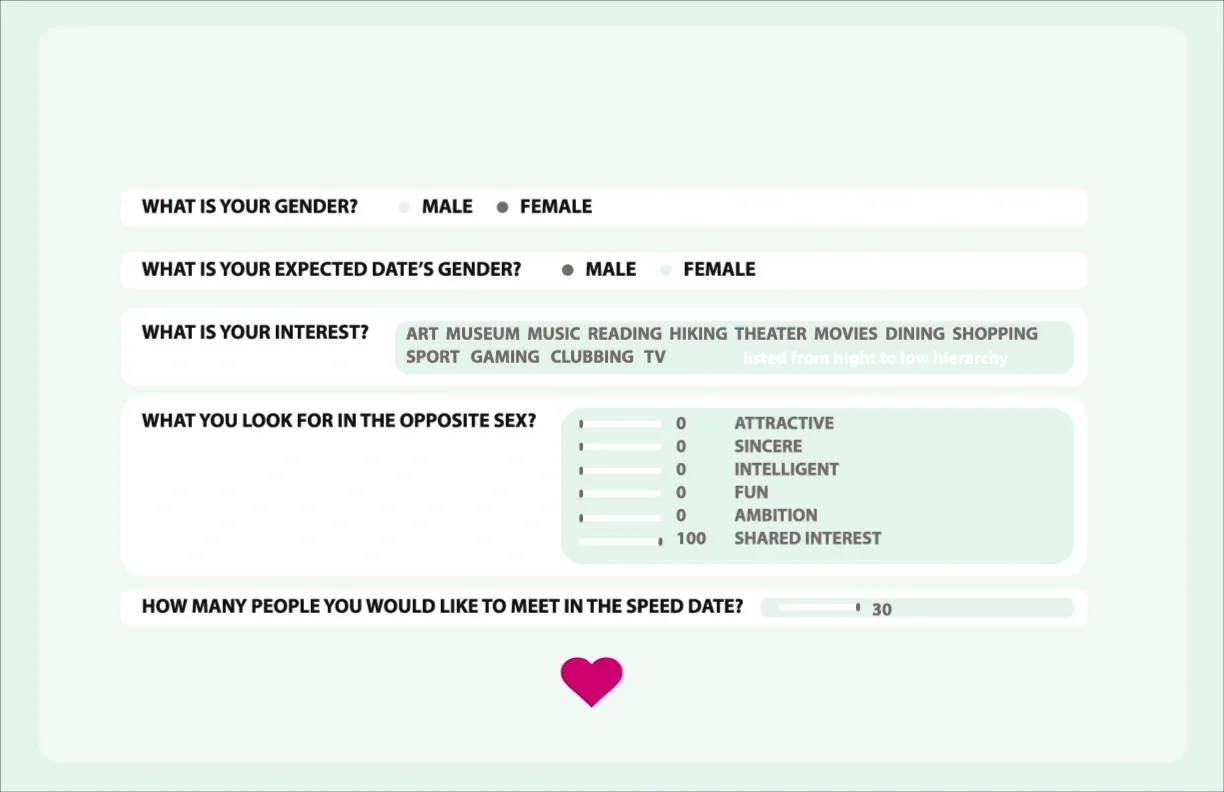
Before the storyline could be recorded, user has to provide basic information, such as his/her preference about the person he/she wants to date.